All palettes
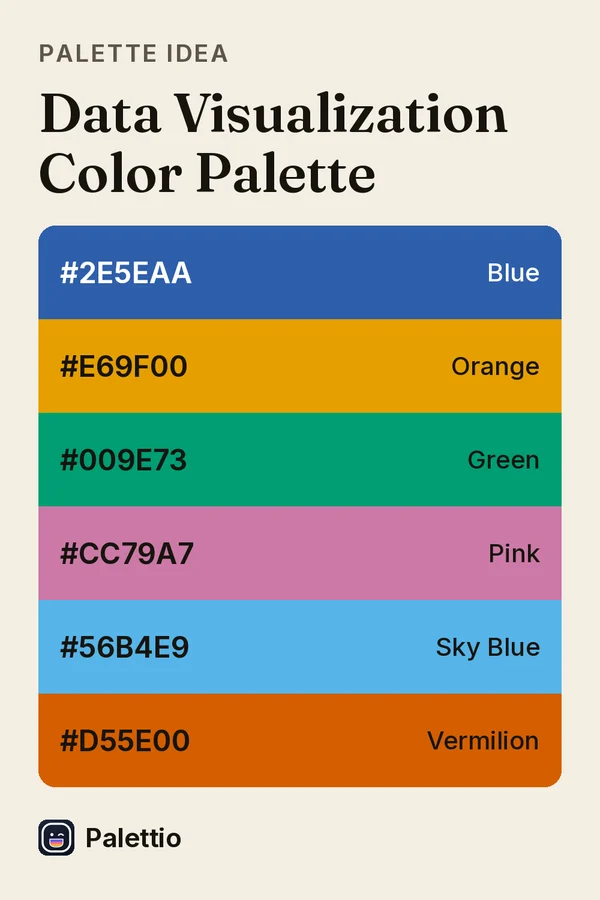
Data Visualization Color Palette
Data Visualization Color Palette for charts, dashboards and slides: blue, orange, green, pink, sky blue and vermilion. Hex codes: blue #2E5EAA, orange #E69F00, green #009E73, pink #CC79A7, sky blue #56B4E9, vermilion #D55E00. Save it in Palettio and copy the codes as CSS or JSON for free.
- Blue
- Orange
- Green
- Pink
- Sky Blue
- Vermilion
Tap a code to copy it.
Make one from your own photo
Palettio pulls the palette out of any photo or screenshot, reads a single color live through the camera, checks contrast, and exports the codes as CSS, JSON and more.